Before you read this, I suggest you read posts 19.20 and 22.11.
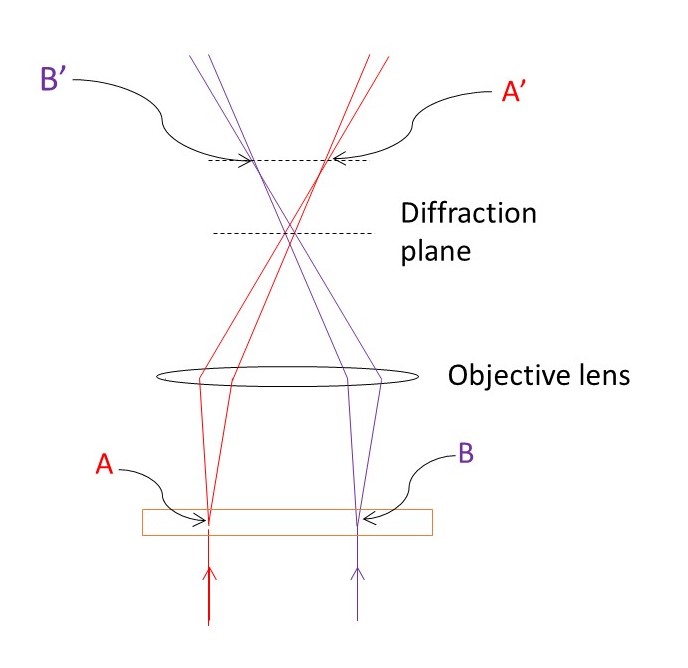
In post 22.11, we saw that a microscope forms an intermediate image which is then magnified to give a final image. The picture above uses ray-tracing to show how the intermediate image, A’B’, is formed from the object AB. But I now want to think about what happens in a plane, perpendicular to the optical axis of the microscope, that I have called the diffraction plane. In this plane, the lens focusses rays scattered in the same direction by A and B to a single point. So, what we see in this plane is the diffraction pattern of the object. The waves that form this diffraction pattern then continue to the A’B’ plane where they form an image.
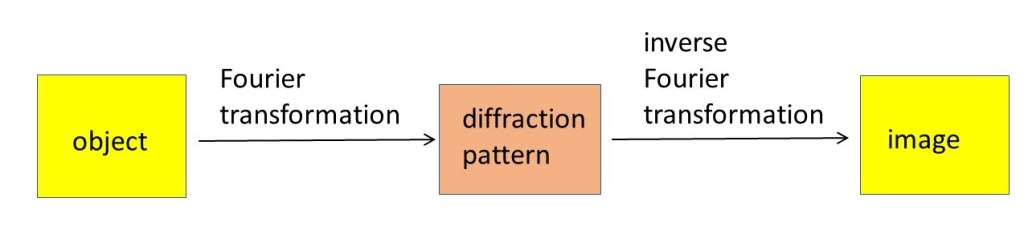
So, we can think of image formation as a two stage process: (1) formation of a diffraction pattern and (2) formation of an image. Let’s continue to think about a one-dimensional object, like AB, and consider the wave δψ scattered by an elemental length δx of this object. In post 19.20, we saw that δψ is represented in amplitude and phase by
δψ = C(δr)eixK.
where C represents the ability of the object to scatter light (or any other waves). Here K is defined to be
where λ is the wavelength of the scattered waves and φ is the angle between the direction of the incident and scattered rays.
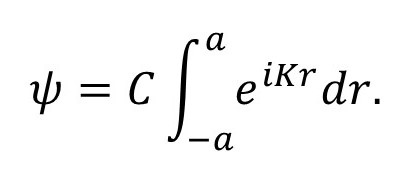
In appendix 1 of post 19.20, we considered C to be constant for a one-dimensional object with – a ≤ x ≤ a. Then the wave function of the scattered wave was
But C could vary with changing x (in general, C is a function of x) and the object could extend throughout our one-dimensional space. Then
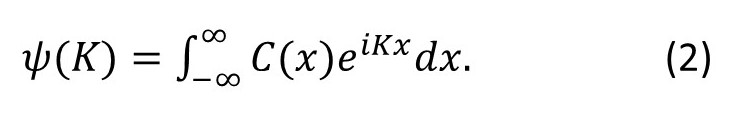
We write C as C(x) to show that it is a function of x and, since the result of the integration is that ψ is a function of K, we write it as ψ(K).
Integrals of the form of equation 2 occur so frequently that they have a special name – the Fourier transform. It is named after the same Fourier who gives his name to the Fourier series. Equation 2 is a one-dimensional Fourier transform.
So, if C(x) represents the distribution of scattering ability in the object, its Fourier transform represents the amplitudes and phases of the waves that make up the diffraction pattern. This is stage 1 of image formation. In stage 2, this process is reversed to form an image whose contrast shows the ability of the object to scatter light. So, stage 2 of image formation reverses the process that occurs in stage 2. A mathematical operation that reverses a previous operation is called its inverse. Then we can represent the two stages of image formation by the picture below.
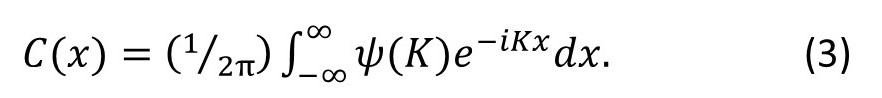
If equation 1 represents the Fourier transform of C(x), then the inverse transform is given, in one dimension, by
Let’s look at a simple example. But you might want to stop reading here because I’ve already covered the important points and even a simple example is a bit complicated, if we look at it in detail.
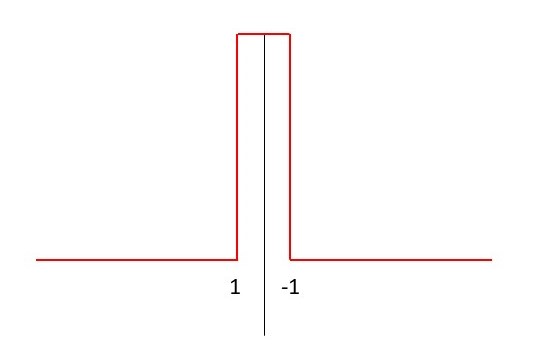
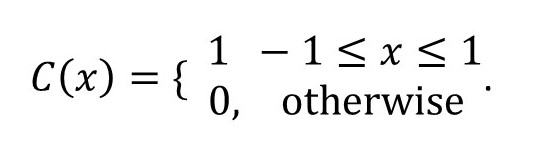
The picture above shows a simple one-dimensional object of width 2 units for which
In case you’re worrying about what our one-dimensional object looks like in two dimensions, see the picture below.

Then, from equation 2,
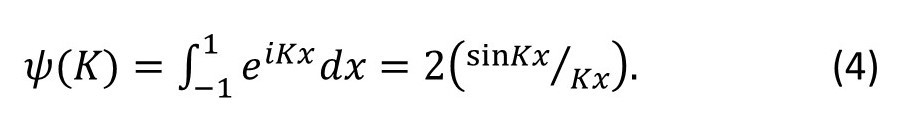
The final step is derived in appendix 1 of post 19.20. Equation 4 represents the amplitude and phase of the wave scattered in the direction given by K (that is, through the scattering angle φ, see equation1). ψ(K) is plotted, against Kx, in the picture below.
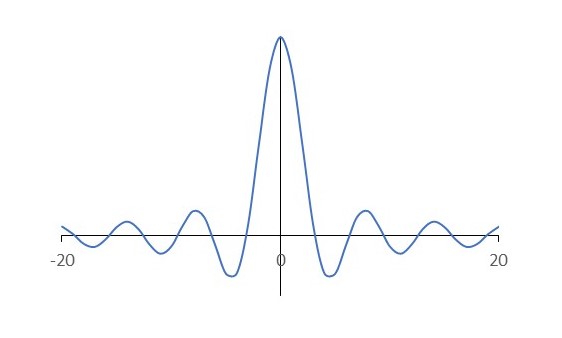
In general, the Fourier transform of an object is a complex number – so why is it real in this example? It is because we have chosen origin so that our object is symmetrical around it – we say that, in this example the origin is a centre of symmetry of the object. According to Euler’s relation
eiKx = cos(Kx) + isin(Kx).
Remember (post 16.50) that cos(-Kx) = cos(Kx) and sin(-Kx) = sin(Kx), so that, for an object with a centre of symmetry we can write equation 2 as
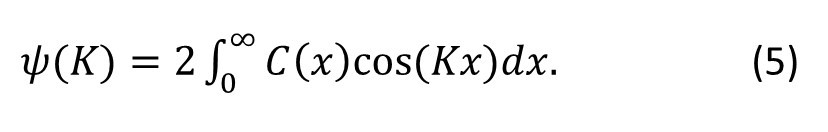
which is real. So the Fourier transform of an object with a centre of symmetry is always real.
If ψ is real (it is not a complex number), how can it represent the phase of the scattered wave? If it is real, the imaginary part of eiKx must be zero (see post 18.17), in other words isin(Kx) must be zero which means that sin(Kx) must be zero. According to post 16.50, this is true when
Kx = nπ n = 0, ±1, ±2, ±3………
noting that π radians is 180o. Since Kx represents the phase of the wave, the phase of the wave must be 0 or π radians, since (for example) a phase difference of 2π (for a sine wave) is the same as a phase difference of 0, 4π, 6π, 8π… and a phase difference of π is the same as a phase difference of 3π, 5π, 7π….(see post 16.50).
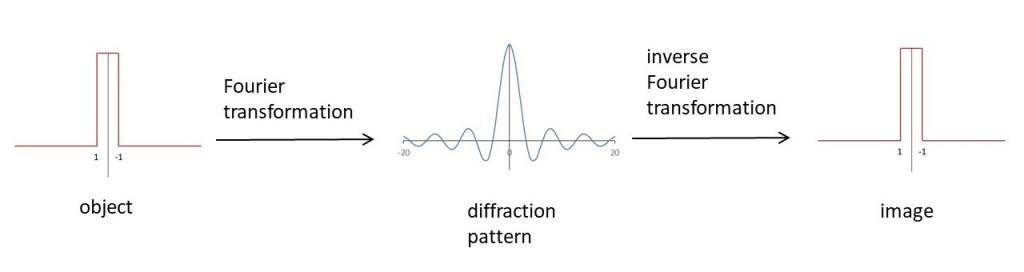
Then we would expect the picture above to show the stages in the formation of our simple object in the microscope. But there is a problem. According to equation 3, formation of the image involves knowledge of an infinite range of K values, that is an infinite range of φ values. But the range of φ values for the rays that pass through the objective lens is finite. In the next post, we will see the implications of this limitation for image formation.
Related posts
22.11 The microscope
19.20 Diffraction
18.14 Wave shapes
Follow-up posts
22.13 Resolution of the microscope
22.14 X-ray diffraction
22.20 Convolution
22.22 Fourier transform of a one-dimensional lattice
22.23 K-space
23.08 Frequency analysis
