Before you read this, I suggest you read post 16.7.

A scientist measures the temperature at which a liquid boils and gets the result 80oC. This result is worthless unless we know how reliable it is. We can gain some idea of the reliability from the number of figures given in the result (see post 16.7). However, it would be better if we knew two things: (1) how repeatable is this result and (2) how good is the thermometer that he/she used to measure the temperature?
The repeatability of the result is called its precision. In order to determine the precision of a measurement, we need to repeat it many times. So, if the results of ten repeat measurements were 80.0, 79.9, 79.8, 80.2, 80.2, 80.1, 79.8, 80.0, 80.1, 80.0 (all in degrees Centigrade), we might conclude that the results were reasonably precise. The best estimate of the temperature, from these results, is given by their mean (average) value of 80.01 that we write as 80.0oC because the experimental measurements were made to one decimal place only (see post 16.7).
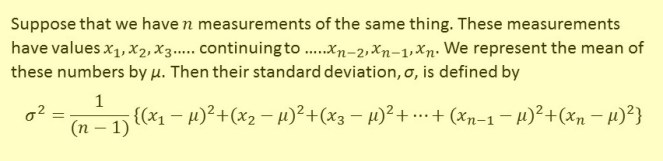
How can we measure precision? One way is to calculate the standard deviation of the results. The box below shows how this is done but you don’t need to read it! I think it is a good idea to always use a spreadsheet for calculations like this – it provides a record of the numbers and avoids calculation errors. (In Microsoft Excel, use the STDEV.S function.) The calculated result is 0.144914oC. So the results for the boiling temperature are 80.0oC with a standard deviation of 0.1oC.
Suppose a different thermometer had given result to three decimal places resulting in a mean of 80.000oC and a standard deviation of 0.132oC. It would be silly to quote the results in this form, because the standard deviation shows that the second and third decimal places in the mean are unreliable. So, again, the results for the boiling temperature are 80.0oC with a standard deviation of 0.1oC.
Why don’t we present the range of experimental results (79.8 to 80.1oC) instead of the standard deviation? To see why, think about these numbers: 80.0, 79.9, 79.8, 80.2, 80.2, 80.1, 79.8, 80.0, 80.1, 99.9. The range of values is 79.8 to 99.9, implying a very wide spread. But there is something very odd about the value of 99.9 because it is very different from the other results. The mean value (82) and standard deviation (6) give a much clearer picture of what the results are telling us.
The second question was – how good is the thermometer that the scientist used? This questions the accuracy of the measurements. Notice the difference between the words “accuracy” and “precision” – the word “accuracy” is often used incorrectly. The scientist could have checked the accuracy of his/her thermometer by measuring the temperature of pure boiling water. If the result was 100oC, everything would be alright. If the result had been different, he/she would have had to correct the results of the experiment to correct for the inaccuracy of the thermometer. This process is called calibration.
Related posts
16.10 Expensive cars and health
16.8 Predictions
16.7 Writing numbers
16.3 Scientific proof
16.1 Drug safety testing
Follow-up posts
